Electrofishing Reporting Guide
Why Zero Desk Reporting?
Zero Desk provides templated reports that integrate with the data you collect in the field. Through Zero Desk, you have access to:
- The data you record in the field
- A collaborative templating engine
- Chart generation without needing to build spreadsheets
- A familiar word-processor-like interface
This guide covers all the features you'll need to create professional electrofishing reports.
The text editor supports copying and pasting content, images, tables, and more between reports. To include charts from past reports, open the old report in one browser tab and the new report in another tab. Then, copy the desired charts from the old report and paste them into the new report. You can use Ctrl+C to copy and Ctrl+V to paste within the editor.
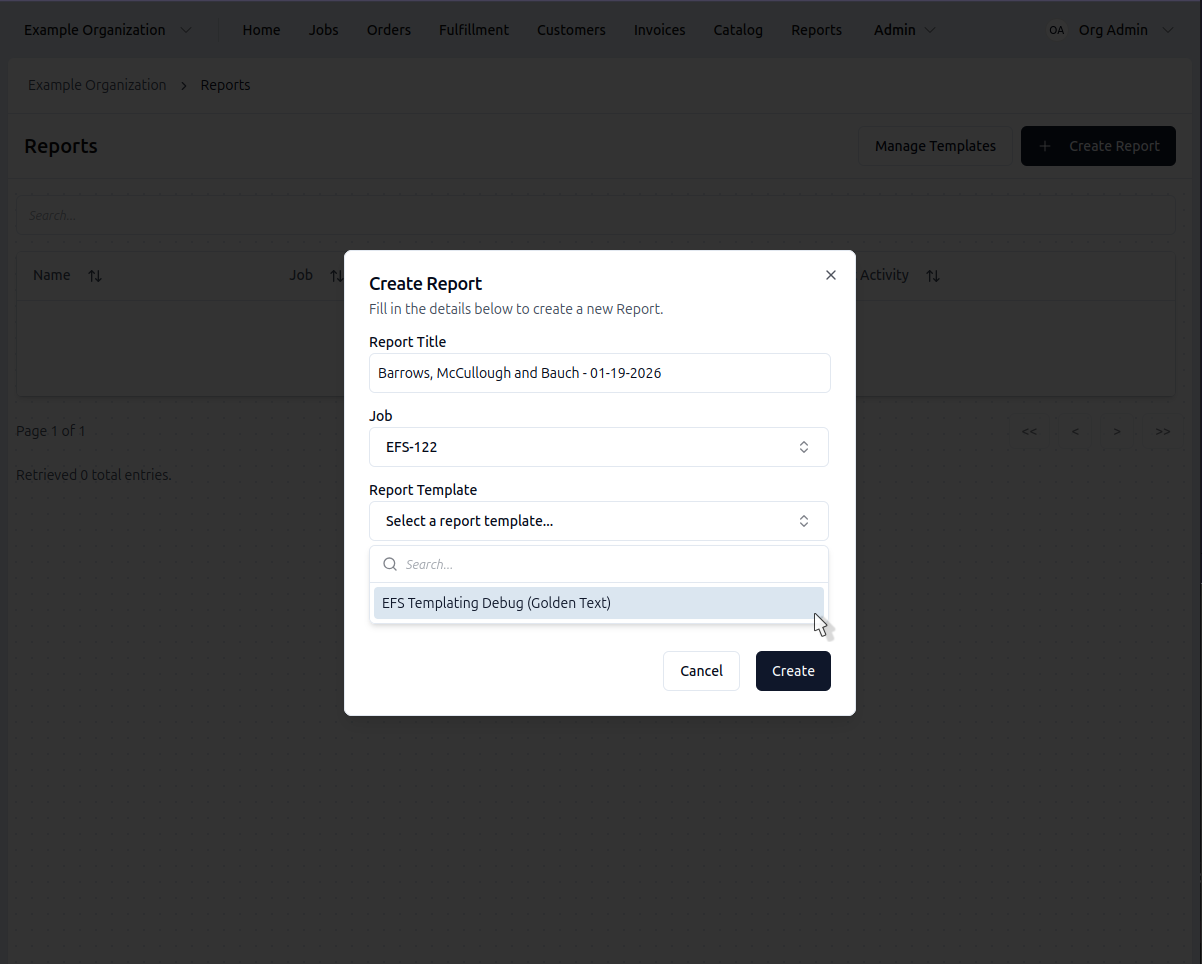
Create a Report
- Click Reports in the navigation
- Click + Create Report
- Give it a name
- Select the job
- Optionally, select the report template you'd like to use
- Click Create
You'll be automatically redirected to your newly created report
You can also create a report directly from a finished job's work tab. Once you've completed your job, click Finish Job and then select Create Report to start a new report for that job.
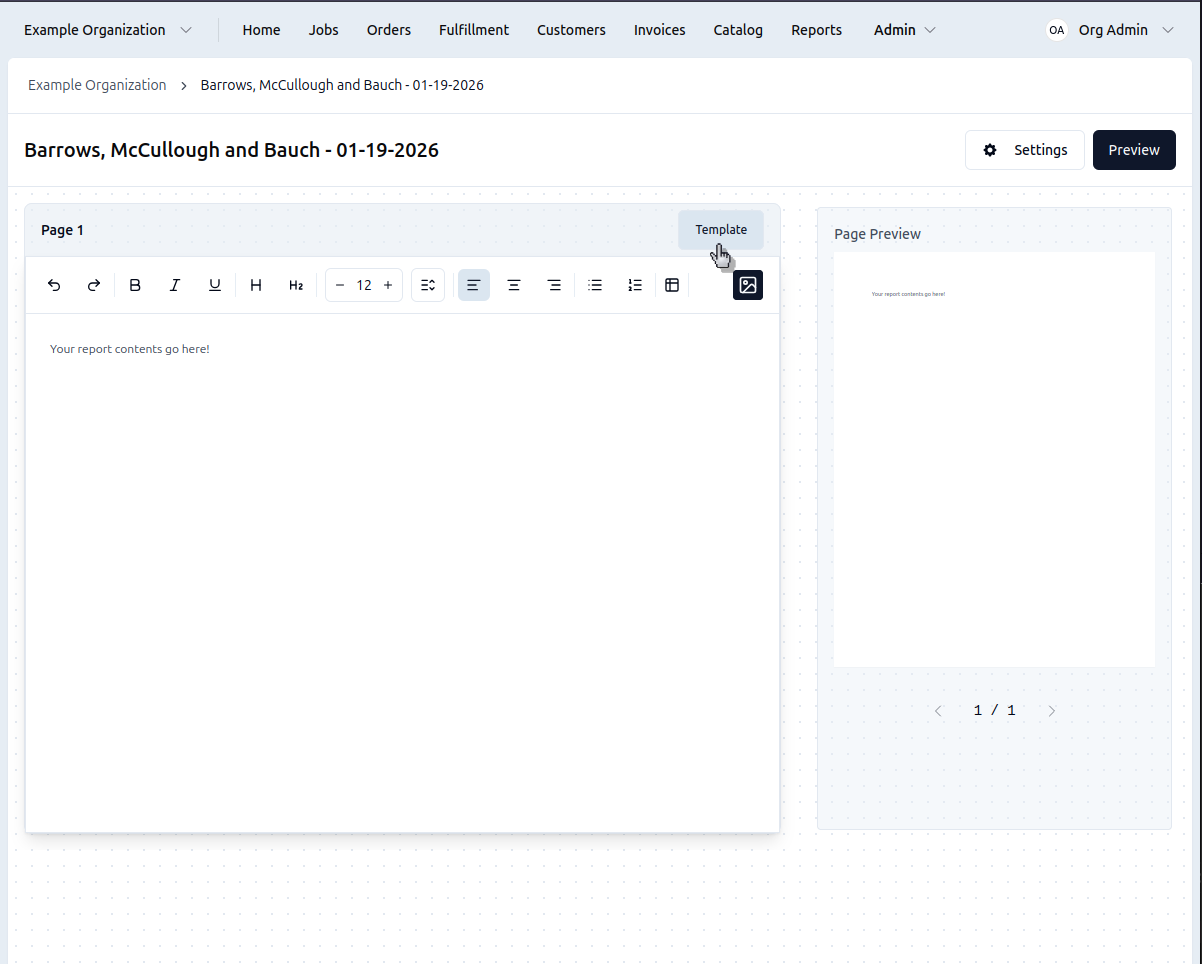
Write Content
Type directly on the page like a word processor. Use the toolbar buttons:
- Bold, italic, underline
- Headings (H2, H3)
- Alignment, list, and table buttons
Press Ctrl+Enter to add a new page
See the Editor Reference for complete toolbar documentation and keyboard shortcuts.
Use the Undo and Redo buttons in the toolbar, or Ctrl+Z to undo and Ctrl+Shift+Z to redo. The editor tracks your recent actions.
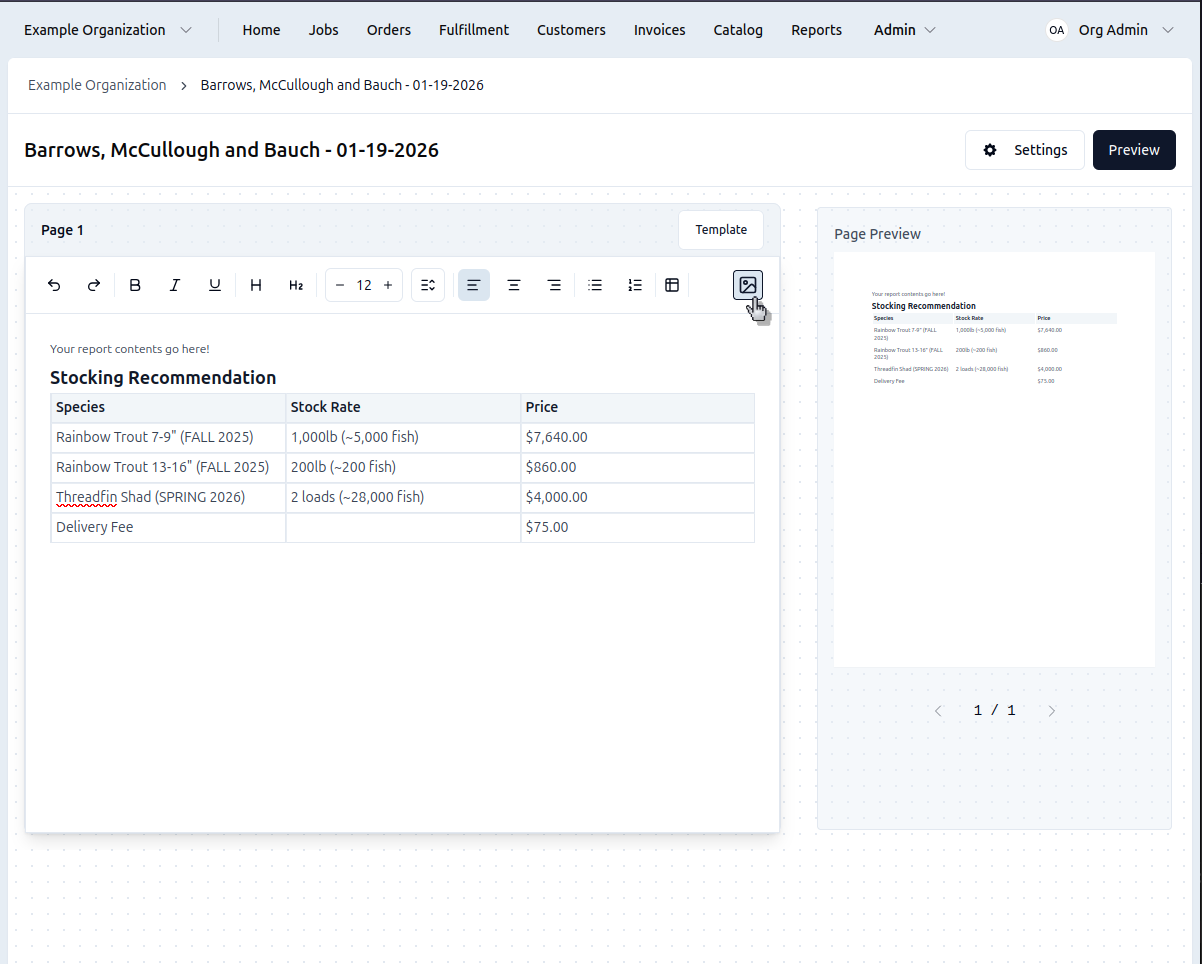
Add Images
- Click the Media button on the far right of the toolbar
- Click the New Image button (the grey square with a '+' on the 1st row)
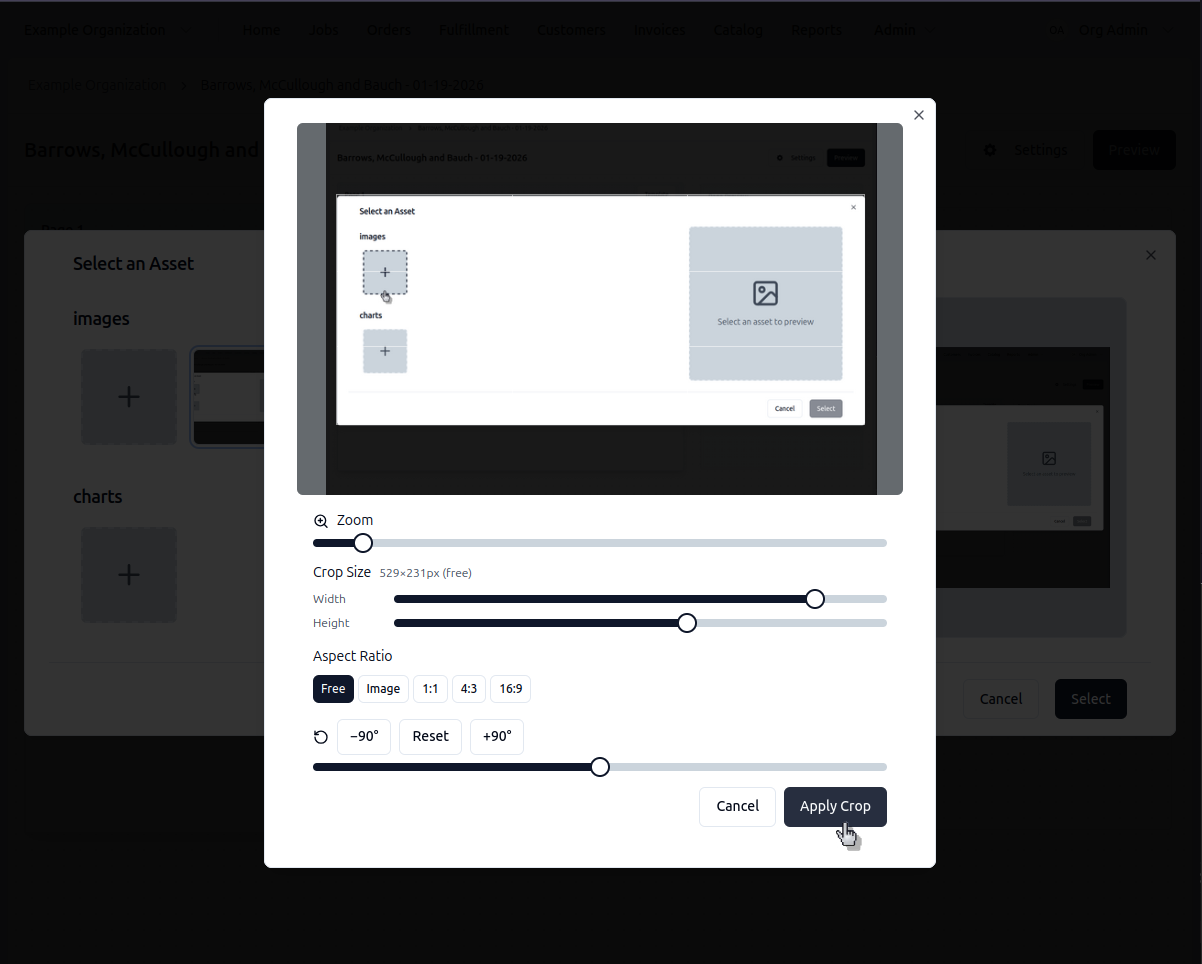
- Crop and rotate the image if needed
- Click Insert
You can edit an image by going back into the media selector and clicking on the image you uploaded previously
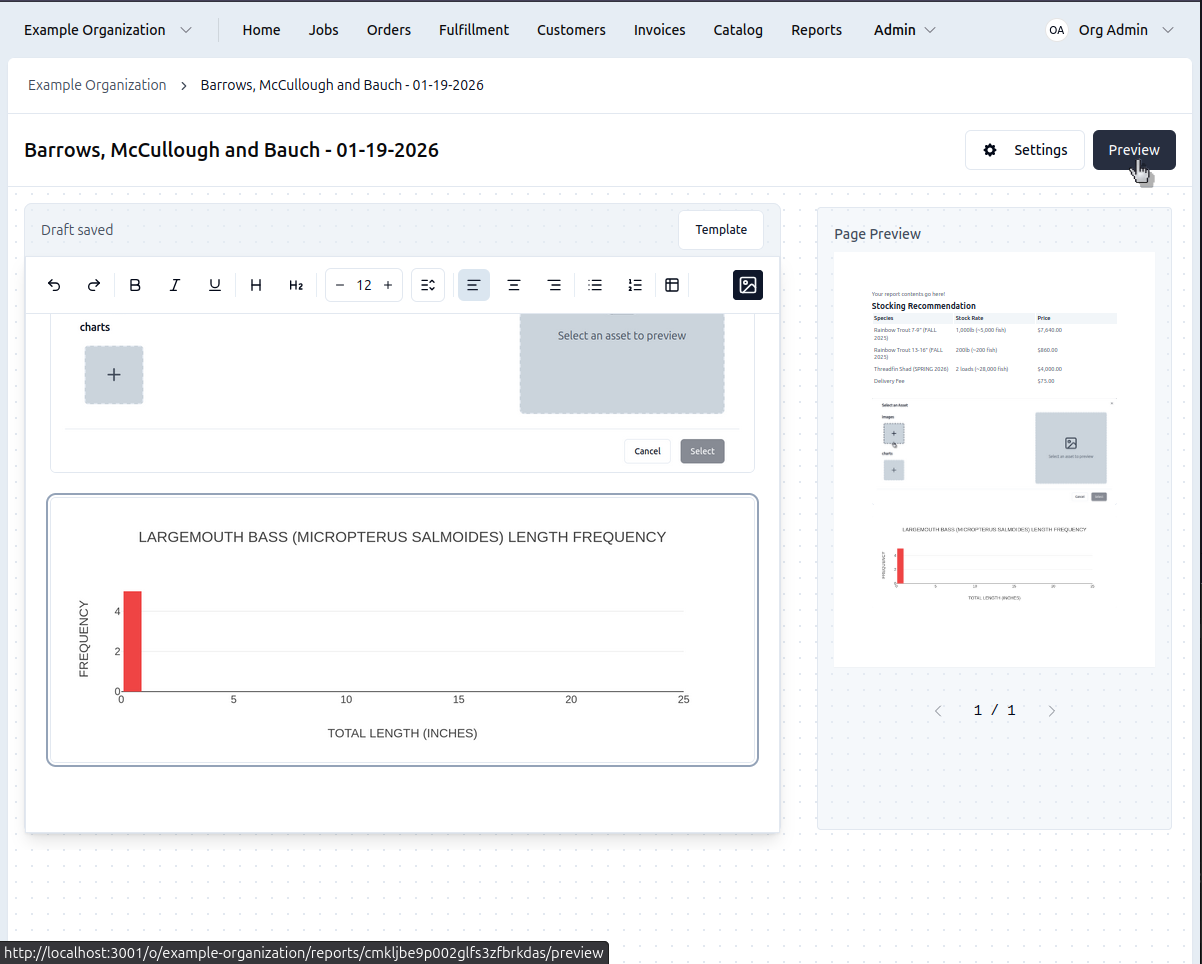
Add a Chart
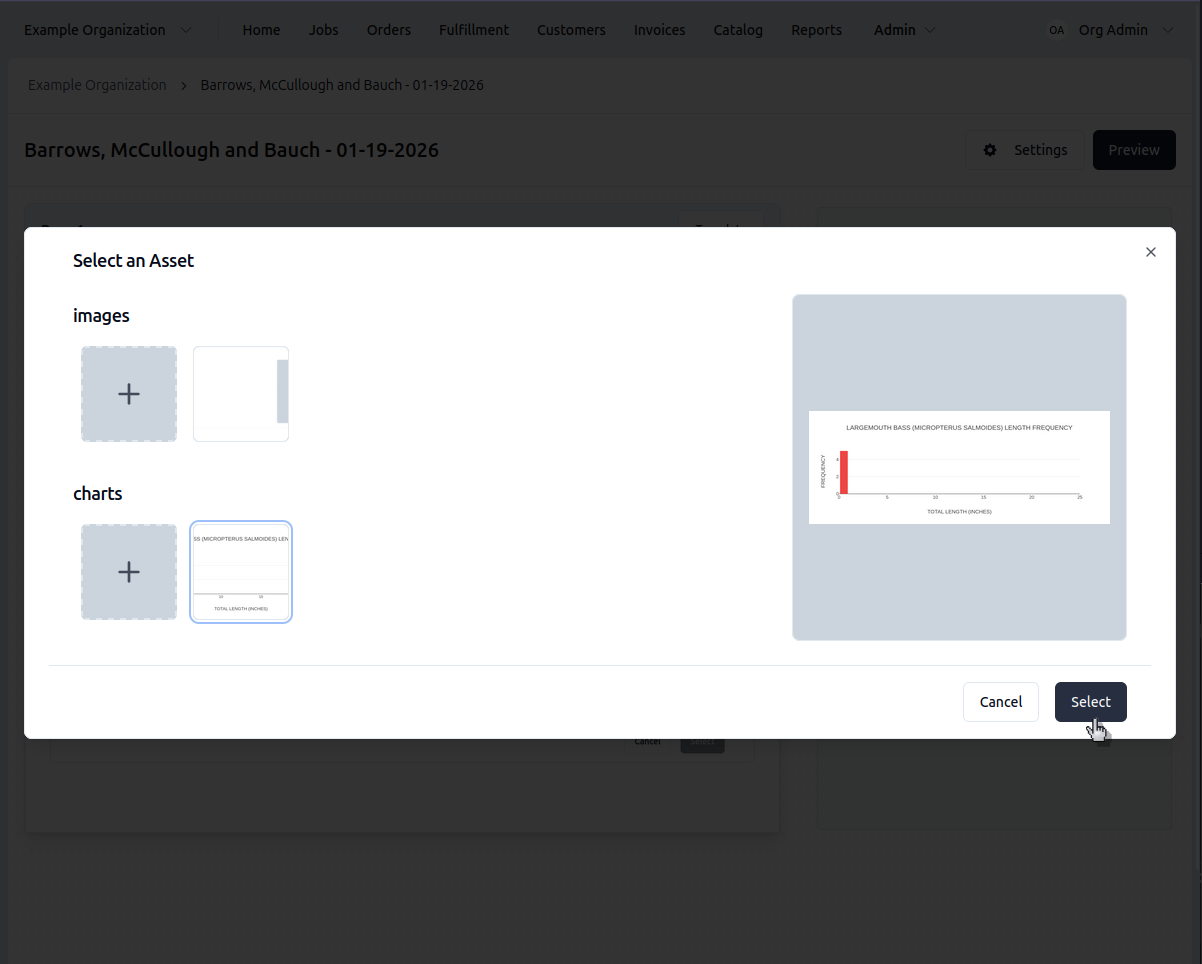
- Click the Media button on the far right of the toolbar
- Click the New Chart button (the grey square with a '+' on the 2nd row)
- Select Length Frequency, Species Comparison, or Relative Weight
- Pick which species to chart
- Adjust the chart settings, if desired
- Click Insert
The chart appears as an image in your report. You can edit the image by following the steps to generate a new chart and selecting the chart to edit, rather than the New Chart button.
Charts cannot be saved as templates. To reuse a chart, open the old report in a separate tab and copy/paste the desired charts between them. See the Editor Reference for detailed instructions.
Export PDF
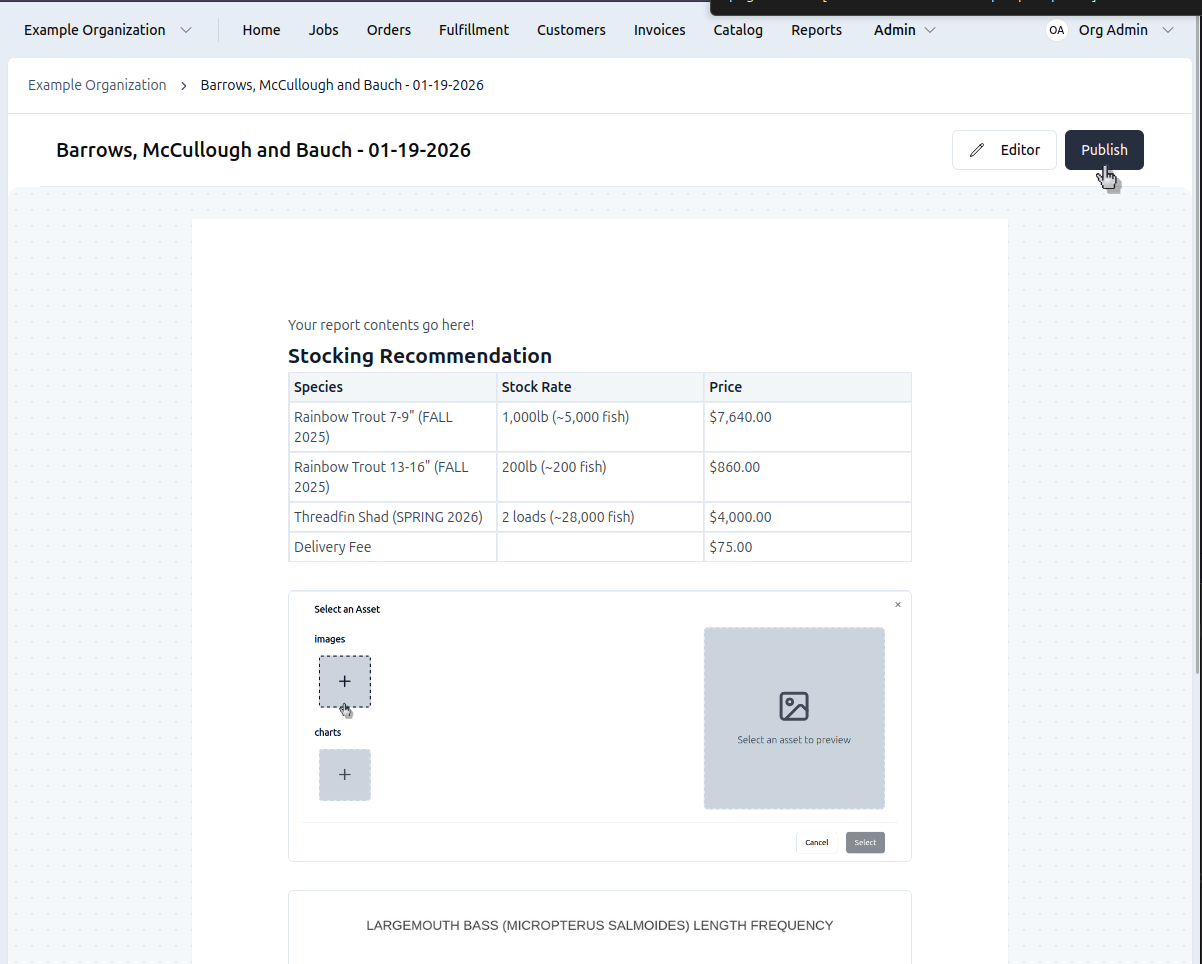
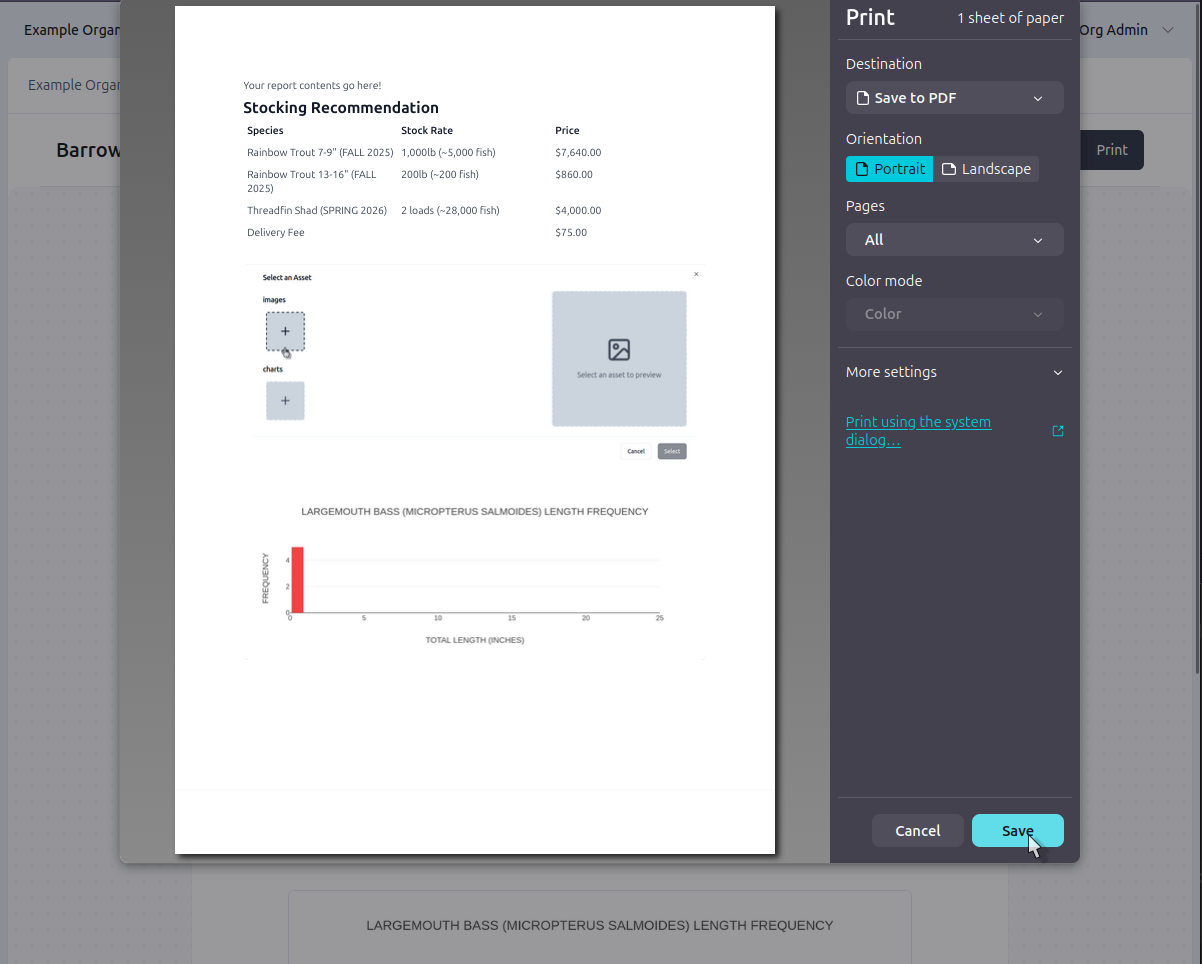
Generate PDF
- Set report Status to Published in the Report Side Sheet
- Review all pages for formatting
- Click Export PDF in top navigation
- PDF generates with all charts, images, and formatting intact
- Download to share with customers
Advanced Features
For complete editor documentation including all toolbar buttons, keyboard shortcuts, and advanced features, see the Editor Reference.
Managing Pages
- ← → - Navigate between pages
- Click page title - Edit the page header inline
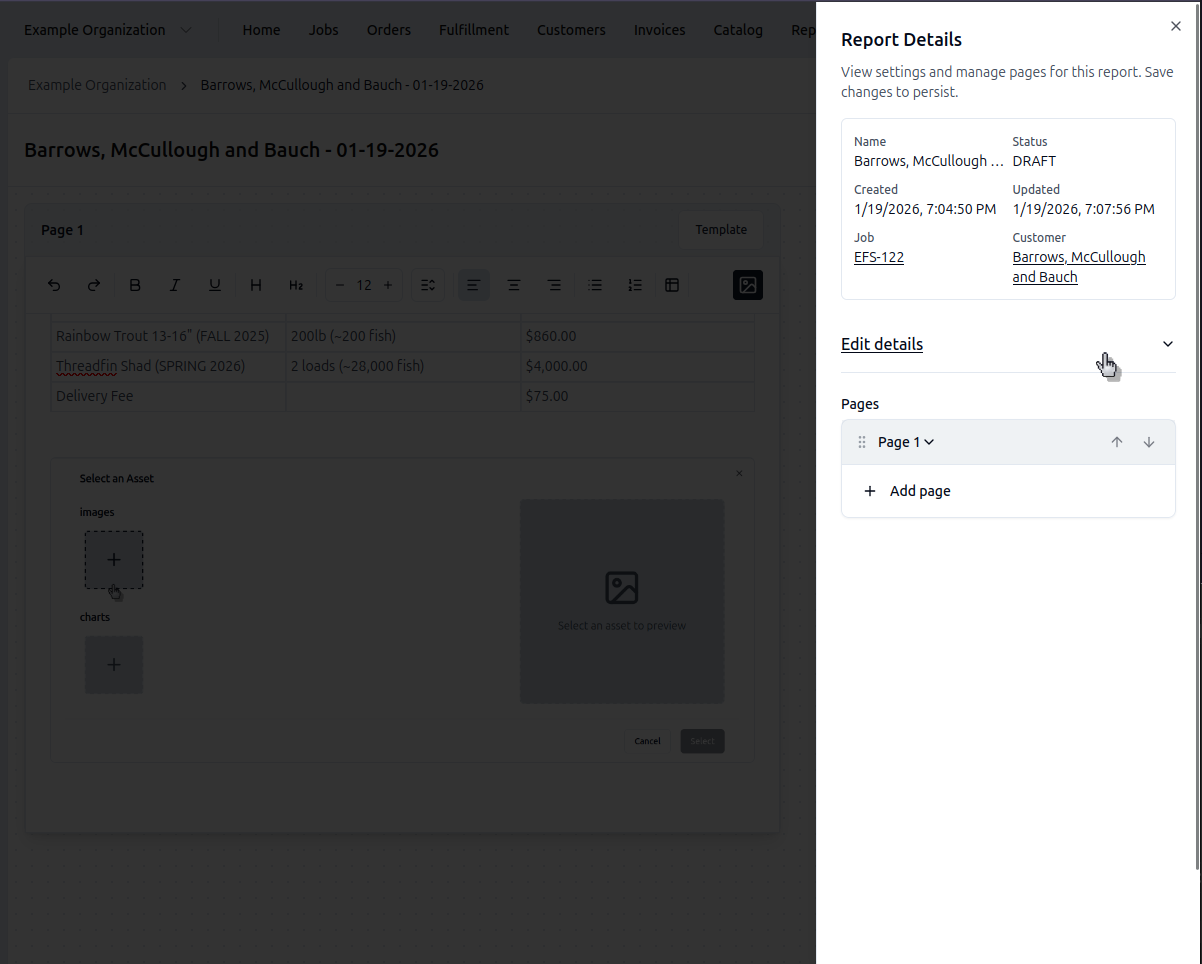
- Settings button - Opens Report Side Sheet
Page Splitting and Merging:
- Ctrl+Enter - Split content to a new page or move content to next page
- Delete at end of page - Merge current page with next page
- Backspace at start of page - Merge current page with previous page
In the Report Side Sheet:
- Drag pages to reorder them
- Click trash icon to delete a page
- Adjust margins (top/right/bottom/left)
- Delete entire report
Press Ctrl+Enter to split content onto a new page. Use Backspace at the top of a page or Delete at the bottom to merge pages together naturally.
Multicolumn Layouts
You can achieve complex formatting through the use of tables. Tables allow you to do things like place text next to an image or show 3 images side-by-side.
- Click the Table icon in the toolbar to insert a table with the desired number of columns (e.g., 2 or 3)
- Insert your text, images, or charts into the table cells (you can cut and paste your content)
- Right-click the table and choose "Hide table borders" for a cleaner look
- Adjust column widths by dragging the cell borders
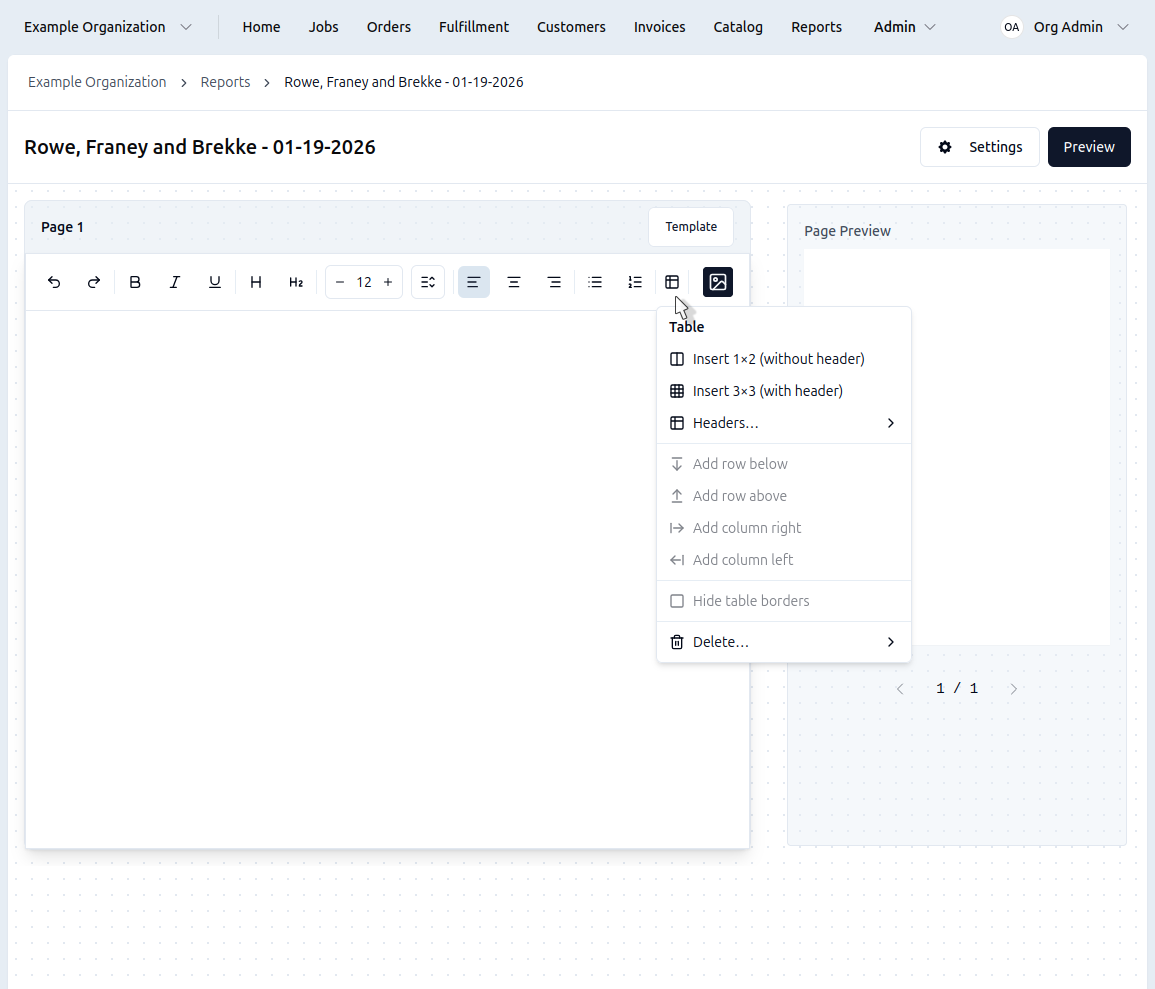
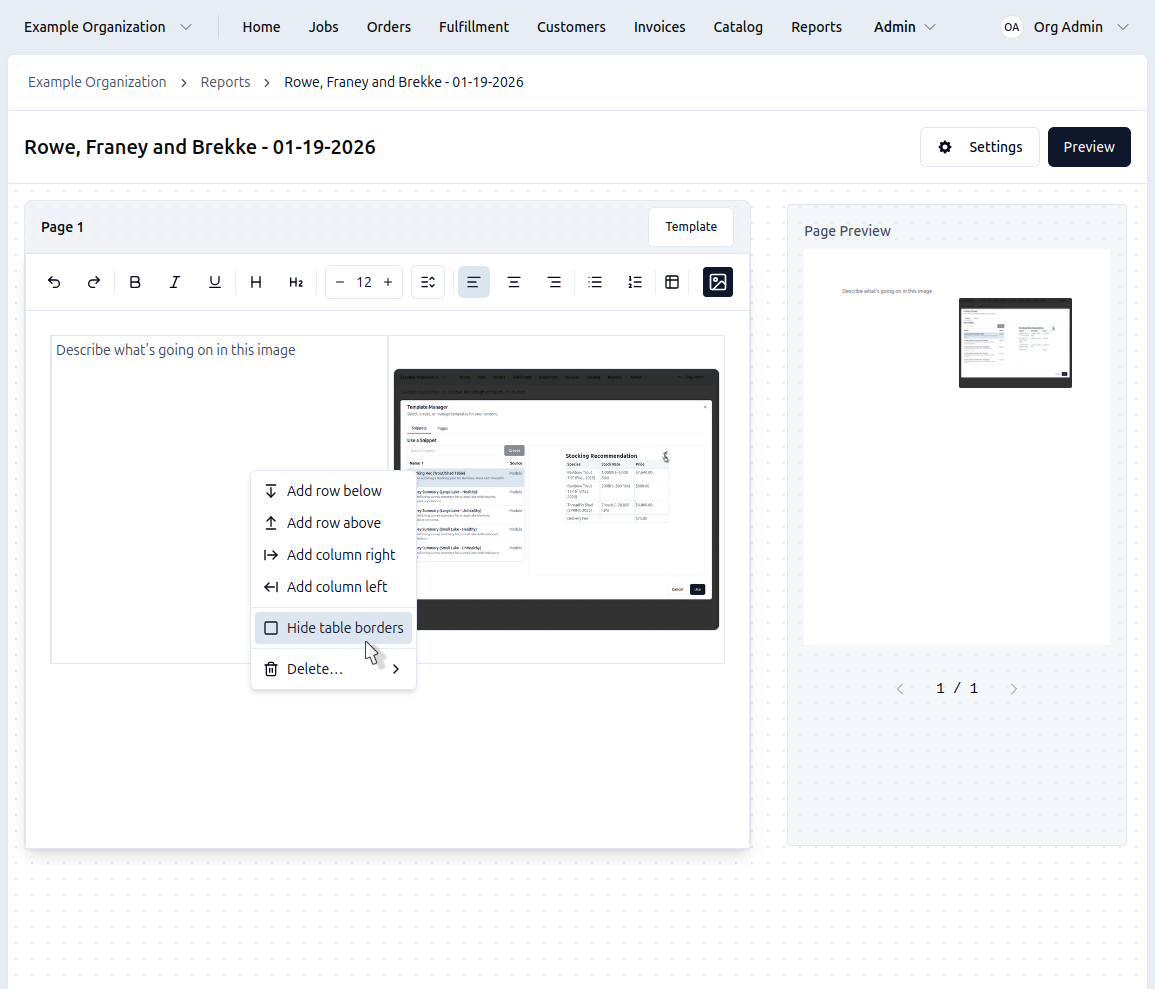
Chart Types
Click the Media icon on the far right of the toolbar to open the Media Selector dialog, where you can create new charts or edit existing ones.
- Length Frequency
- Species Comparison
- Relative Weight
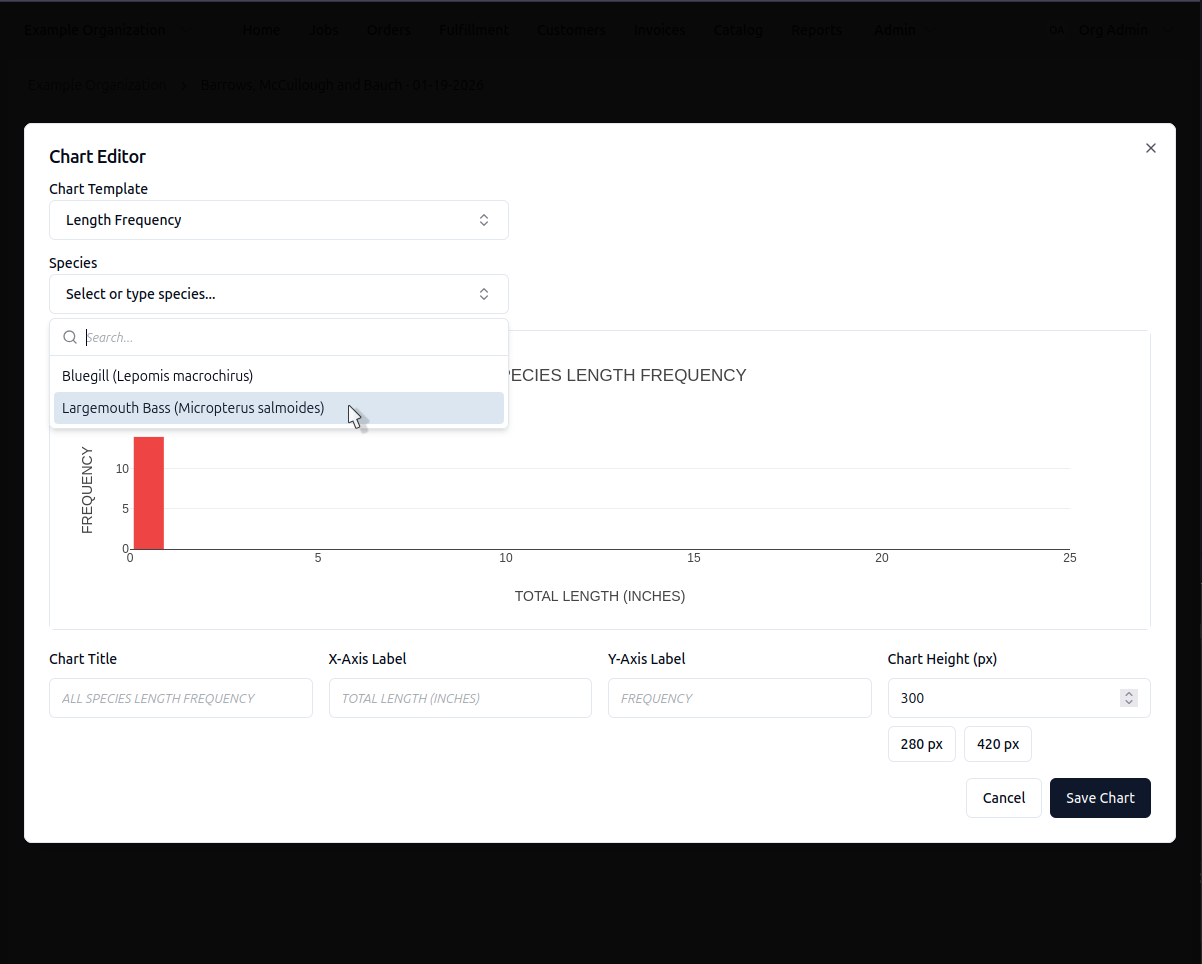
Length Frequency Chart
Shows fish counts in 1-inch length bins (0-25 inches):
- Step 1: Select "Length Frequency" chart type
- Step 2: Choose which species to chart from dropdown
- Step 3: Customize title and axis labels if needed
- Preview updates in real-time
- Click Insert to add to your report
Comparing Two Species
Useful for showing predator-prey relationships or competition:
- Select Length Frequency Comparison
- Choose your first species (e.g., Shellcracker)
- Choose your second species (e.g., Bluegill)
- The chart displays both side-by-side for easy comparison
Relative Weight (Bass Only)
Shows if bass are above or below ideal weight for their length:
- There are no configuration options for this chart yet
- Note that the average appears in the chart title
This chart only works for Largemouth Bass data.
Report Settings
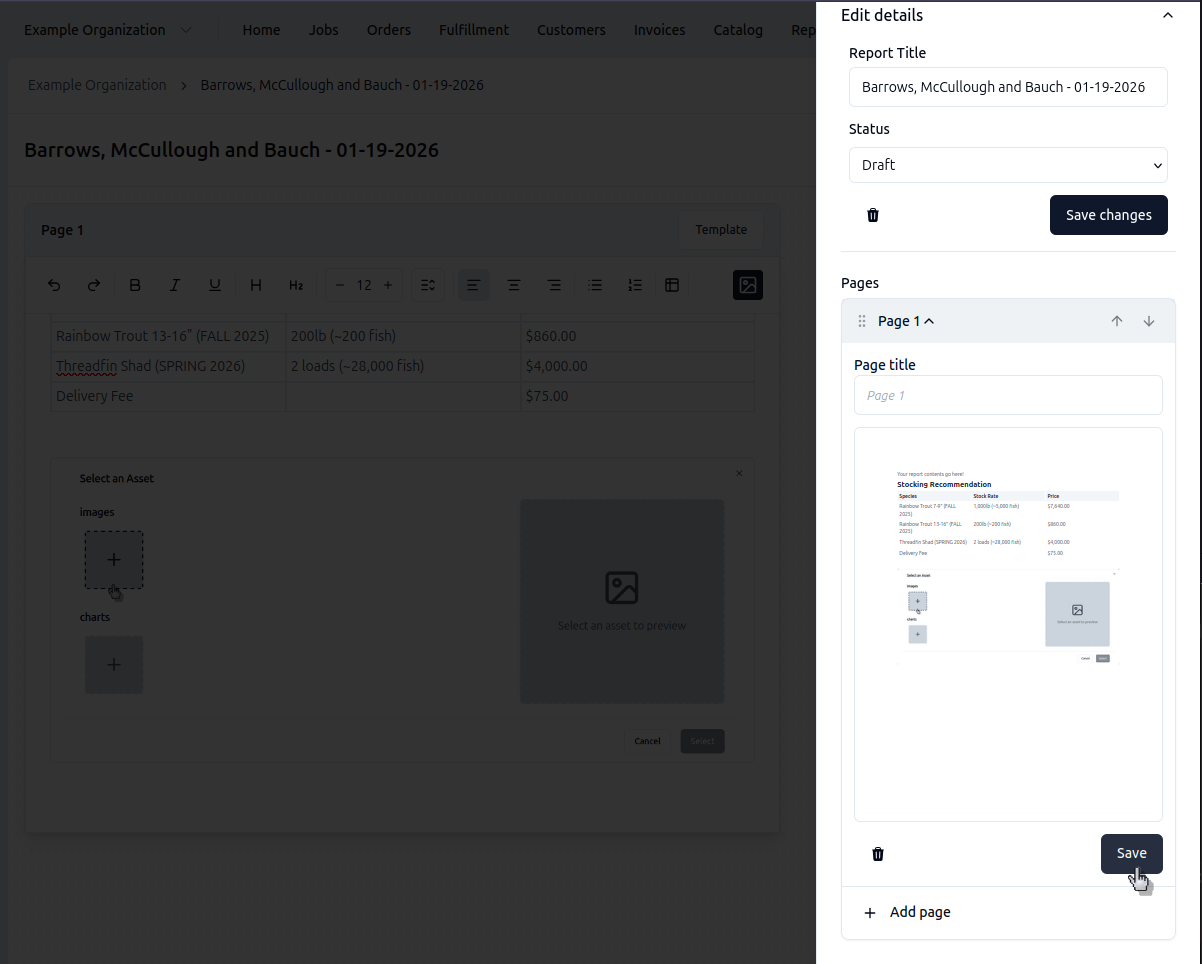
Click the Settings button in top navigation to open the side sheet, then click the dropdown at the top for the report settings
- Report Name: Edit what the report is listed as
- Status: Set to Draft, Published, or Archived
- Delete Report: Click the trash icon to delete the entire report
- Page Order: Drag pages to reorder, then click save
- Delete Pages: Click dropdown next to a page to expand it's options, then click the trash icon to delete the page