Report Editor Reference
Introduction
The Zero Desk Report Editor is a rich text editor that makes it easy to create professional electrofishing reports. This guide covers all the features you'll need to craft detailed, customized reports using the editor's tools.
Editor Layout
The Report Editor has three main areas:
- Top Navigation - Save, export, settings, and page controls
- Main Canvas - Your report content (type here like a word processor)
- Variable Sidebar - Available template variables (right side)
The editor auto-saves every 3 seconds. Look for the save indicator in the top corner.
Toolbar Reference
- Text Formatting
- Tables & Media
Text Formatting Buttons
- Undo - Undo last action
- Redo - Redo last undone action
- B - Bold
- I - Italic
- U - Underline
- H2 - Heading 2
- H3 - Heading 3
- Font size - Adjust text size
- Line height - Adjust line spacing
- Align left - Left align text
- Align center - Center text
- Align right - Right align text
- Bullet list - Unordered list
- Numbered list - Ordered list
Insert Buttons
- Table icon - Insert a table (right-click on table for options)
- Image icon - Open Media Selector to upload/browse images
Keyboard Shortcuts
| Shortcut | Action |
|---|---|
| Ctrl+Z | Undo |
| Ctrl+Y | Redo |
| Ctrl+B | Bold |
| Ctrl+I | Italic |
| Ctrl+U | Underline |
| Ctrl+S | Save (also auto-saves every 3s) |
| Ctrl+Enter | Move content to next page |
| Delete (at end of page) | Merge with next page |
| Backspace (at start of page) | Merge with previous page |
Some keyboard shortcuts depend on browser support and may vary between browsers.
Type --- to create a horizontal line.
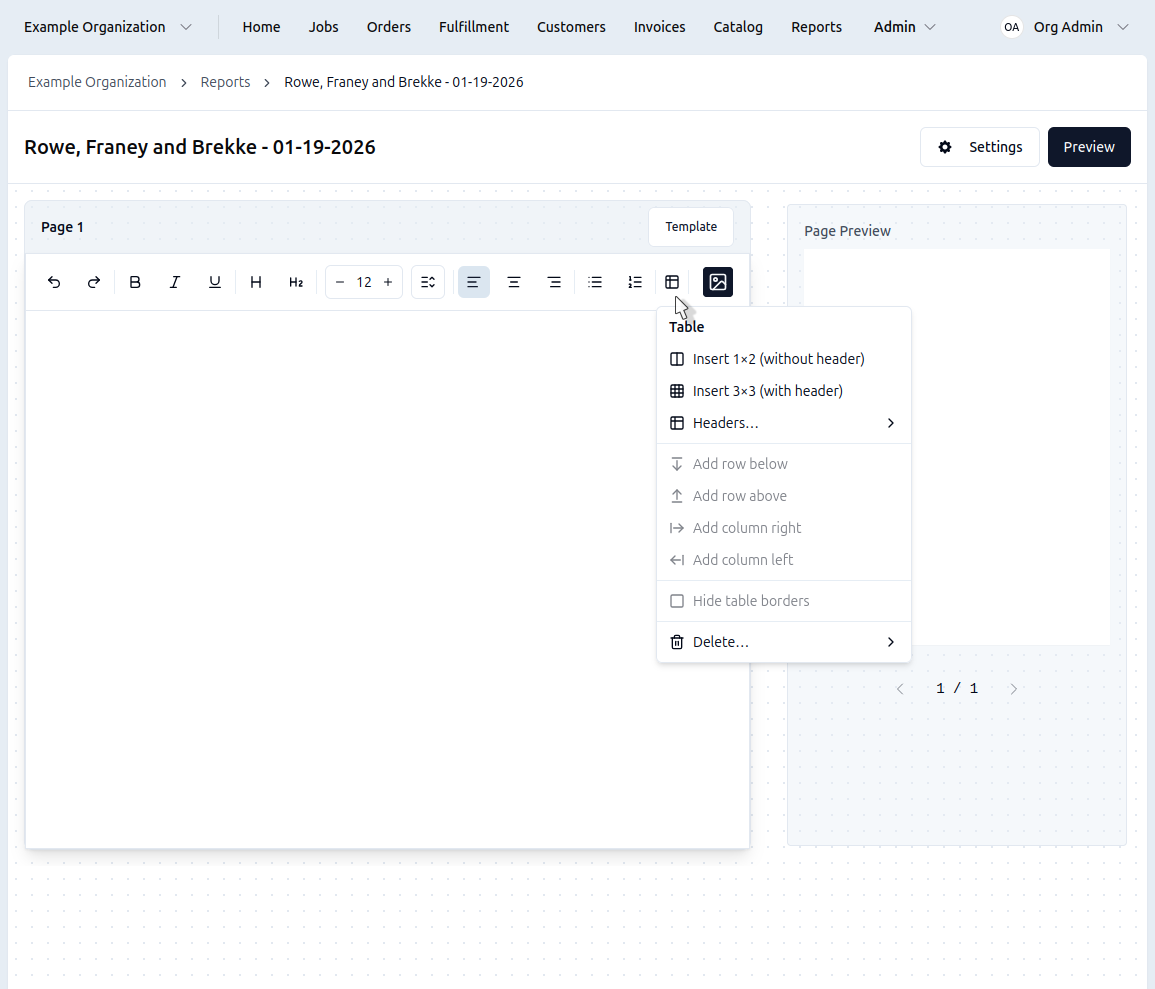
Working with Tables
Table Controls
- Click the Table icon to insert a table
- Click inside a cell to type
- Right-click on the table for options:
Row Operations
- Add row below
- Add row above
Column Operations
- Add column right
- Add column left
Display Options
- Hide table borders / Show table borders
Delete Operations
- Delete row
- Delete column
- Delete table (requires confirmation)
Right-click any table and choose "Hide table borders" for a cleaner look in your reports. You can show them again later.
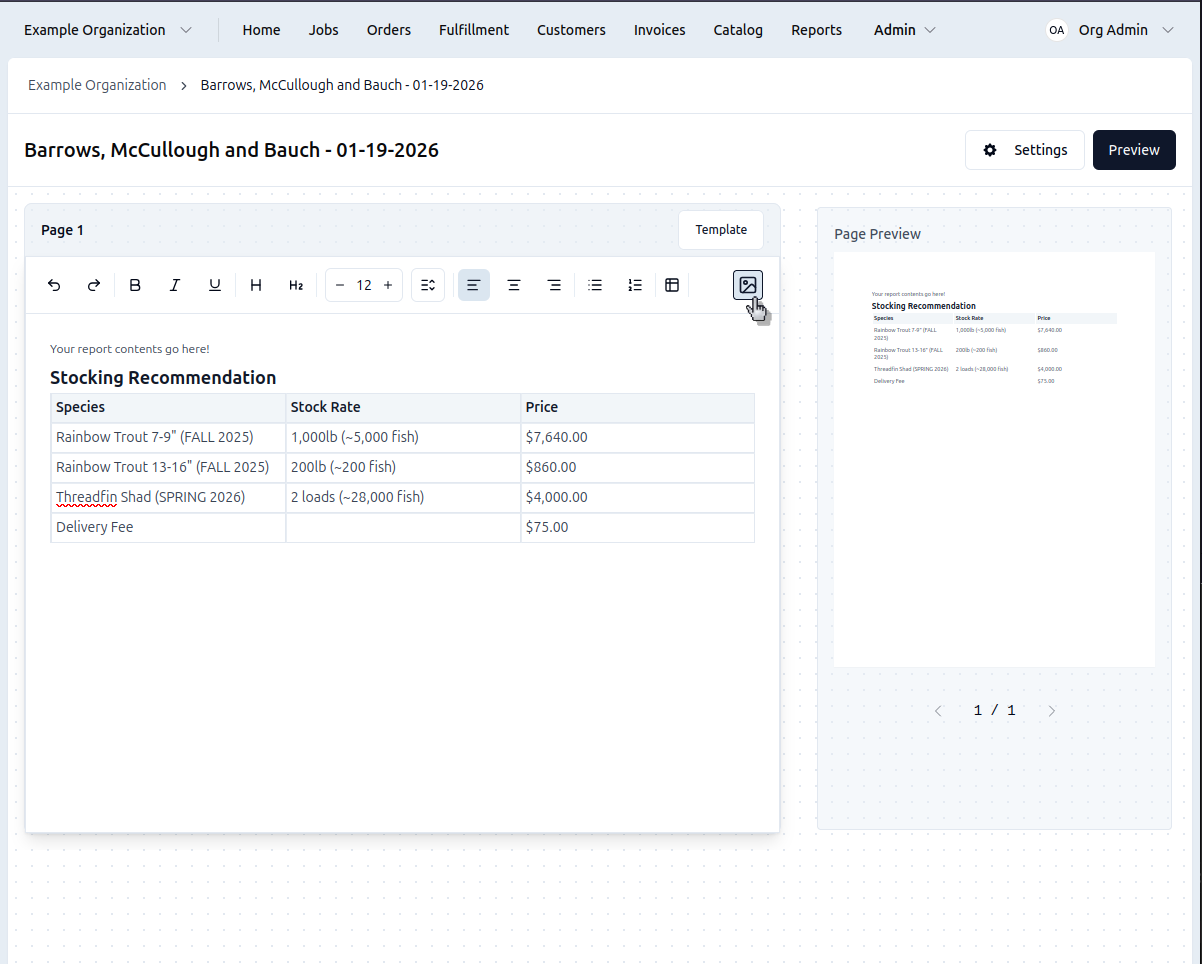
Media Selector
Adding Images
Click the Image icon in the toolbar to open the Media Selector:
- Click Upload or drag files (max 50MB)
- Use crop/rotate tools to adjust images
- Select image and click Insert to add to canvas
- Resize image in canvas by dragging corners
All uploaded images are saved to the job's media library for reuse.
To copy an image from a previous report, open both reports in separate browser tabs. Select the image in the old report, press Ctrl+C to copy, then click in the new report and press Ctrl+V to paste.
Chart Editor
- Length Frequency
- Species Comparison
- Relative Weight
Length Frequency Chart
Shows fish counts in 1-inch length bins (0-25 inches):
- Step 1: Select "Length Frequency" chart type
- Step 2: Choose which species to chart from dropdown
- Step 3: Customize title and axis labels if needed
- Preview updates in real-time
- Click Insert to add to your report
Comparing Two Species
Useful for showing predator-prey relationships or competition:
- Select Length Frequency Comparison
- Choose your first species (e.g., Largemouth Bass)
- Choose your second species (e.g., Bluegill)
- The chart displays both side-by-side for easy comparison
Relative Weight (Bass Only)
Shows if bass are above or below ideal weight for their length:
- Points above 100 = heavier than average (good)
- Points below 100 = thinner than average (may indicate competition)
- The average appears in the chart title
This chart only works for Largemouth Bass data.
Charts are generated from job data and cannot be saved as templates. To reuse a chart from a past report, open both the old and new reports in separate browser tabs, then copy and paste the chart between them.